> ## Documentation Index
> Fetch the complete documentation index at: https://docs.ticketspotapp.com/llms.txt
> Use this file to discover all available pages before exploring further.
# Analytics Overview
Your **Analytics Dashboard** gives you a complete, real-time view of how your event is performing. Whether you're tracking sales, monitoring check-ins, reviewing abandoned carts, or analyzing event views, this section helps you understand everything at a glance.
Let’s get started 🚀
## Navigation
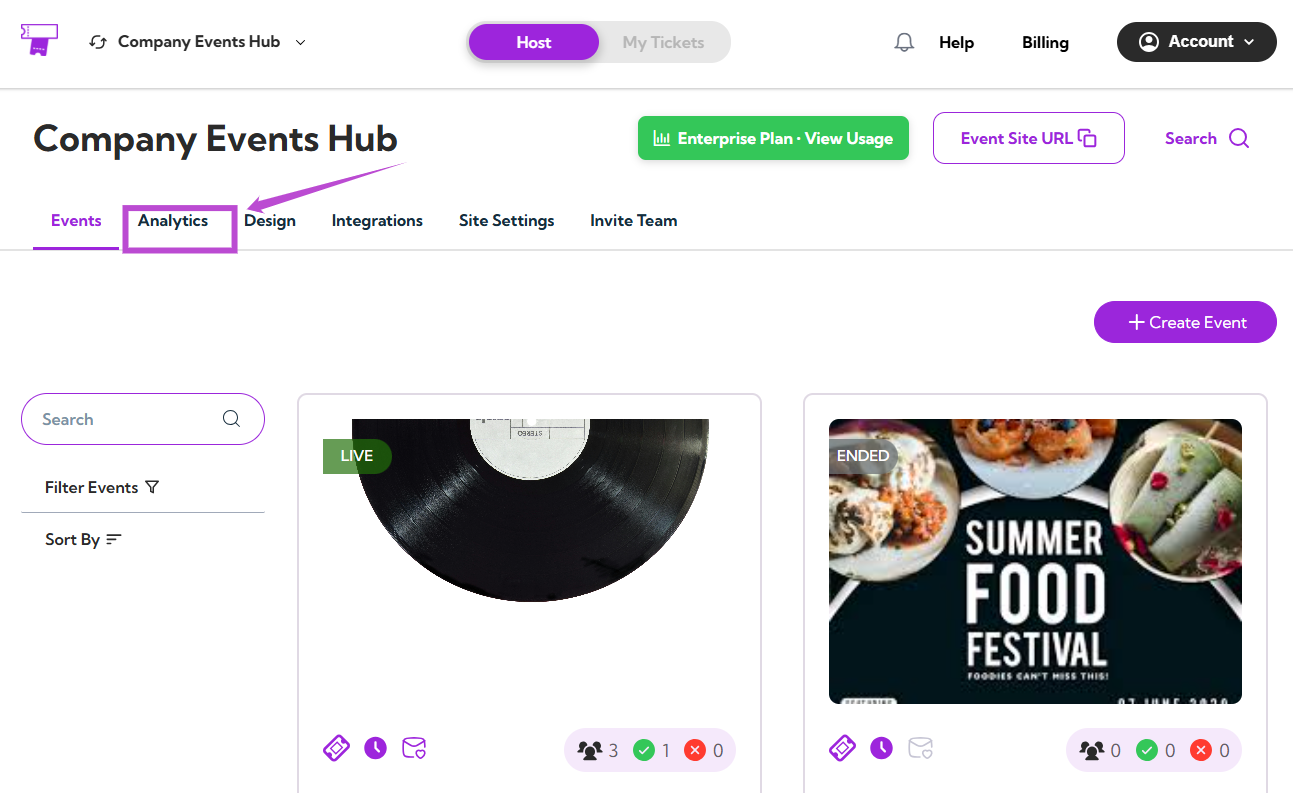
**Step 1**: Log in to your **TicketSpot** account and click the **Analytics** tab from the top navigation bar.
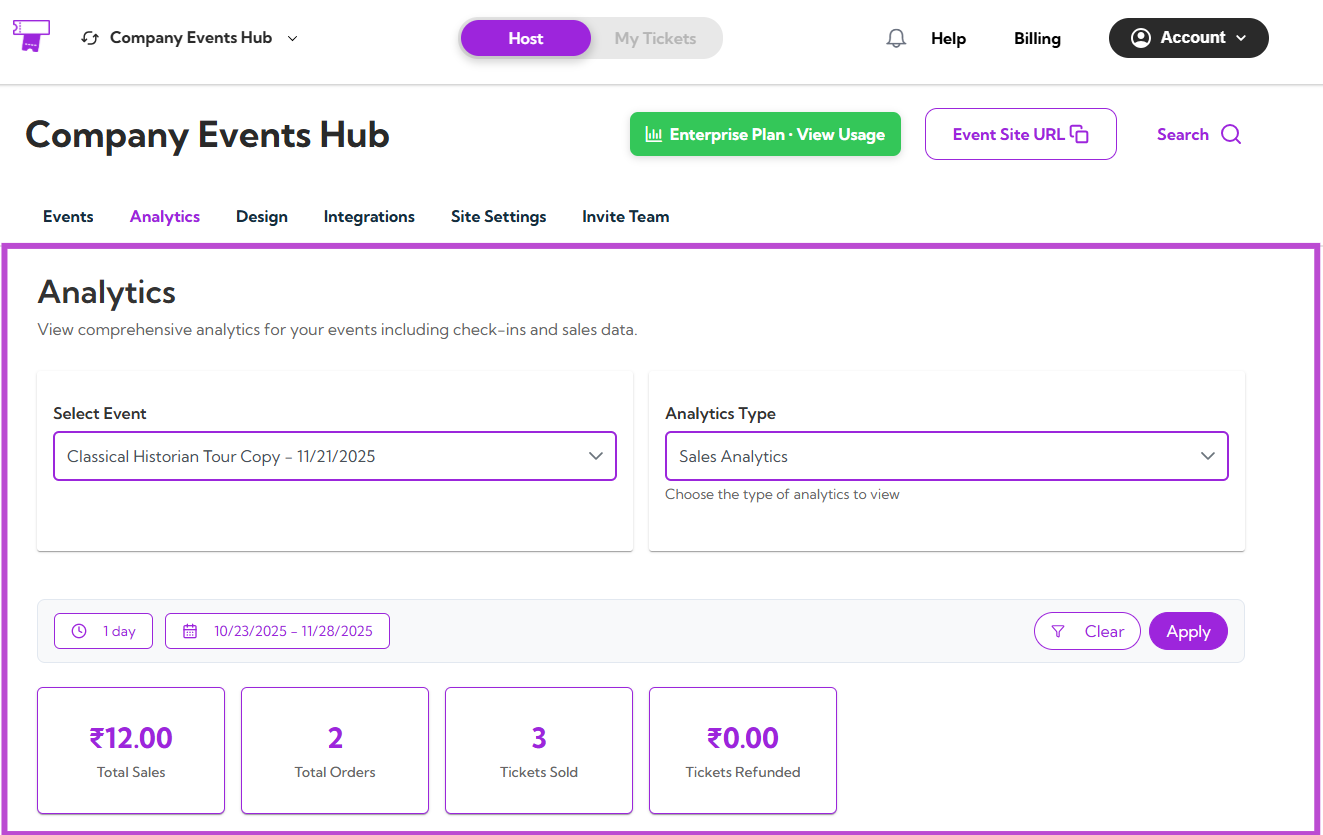
 **Step 2**: You’ll be taken to the **Analytics Dashboard**, where you can view all analytics.
 ## Analytics Dashboard
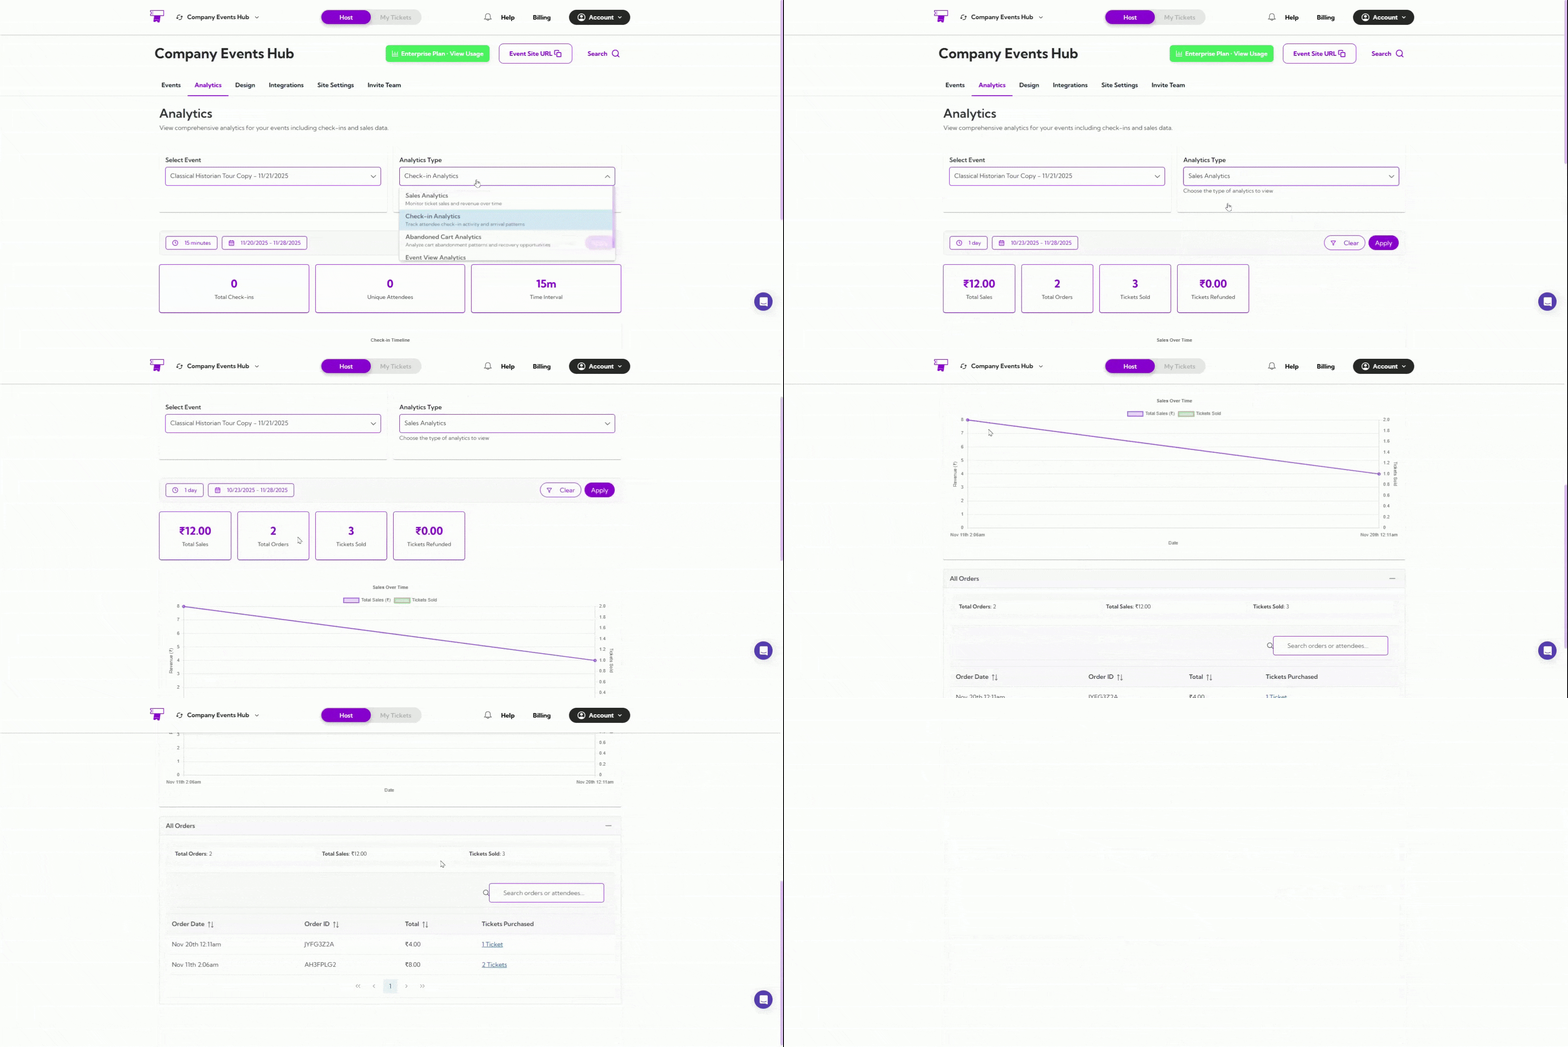
The Analytics Dashboard gives you a clear overview of your event performance. From here, you can:
* Select the event
* Choose the analytics type
* Apply date filters
* View key metrics
* Explore graphs and activity insights
### Event Filter
Choose the event you want to analyze from the **Select Event** dropdown.
## Analytics Dashboard
The Analytics Dashboard gives you a clear overview of your event performance. From here, you can:
* Select the event
* Choose the analytics type
* Apply date filters
* View key metrics
* Explore graphs and activity insights
### Event Filter
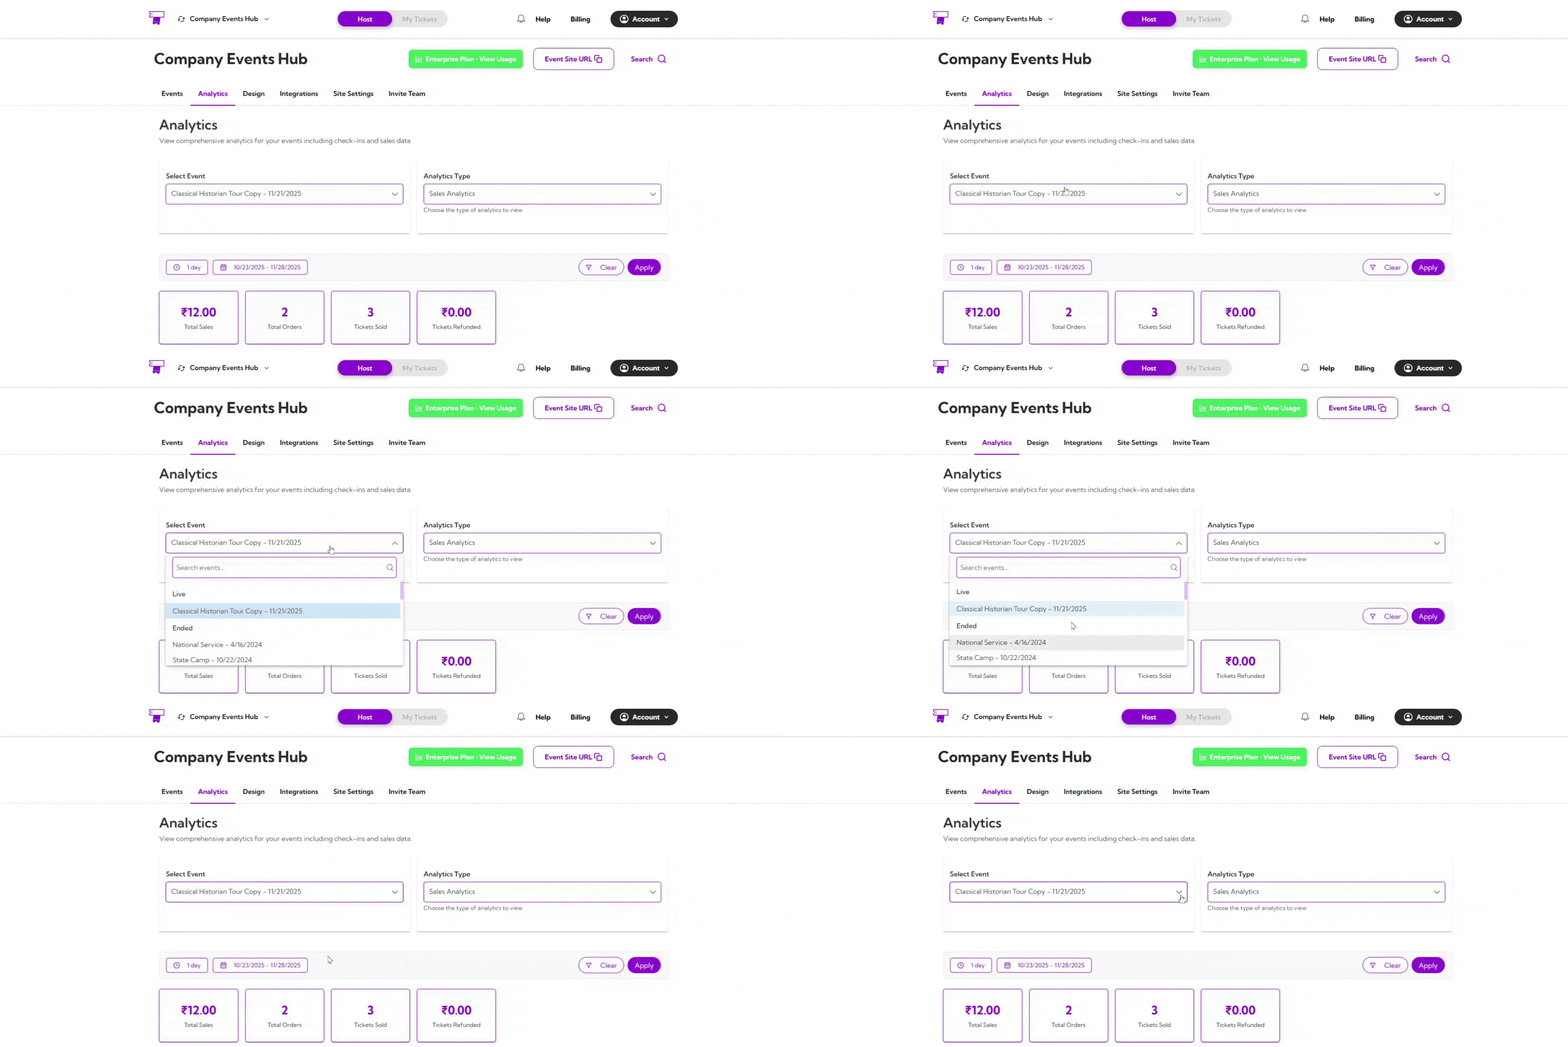
Choose the event you want to analyze from the **Select Event** dropdown.
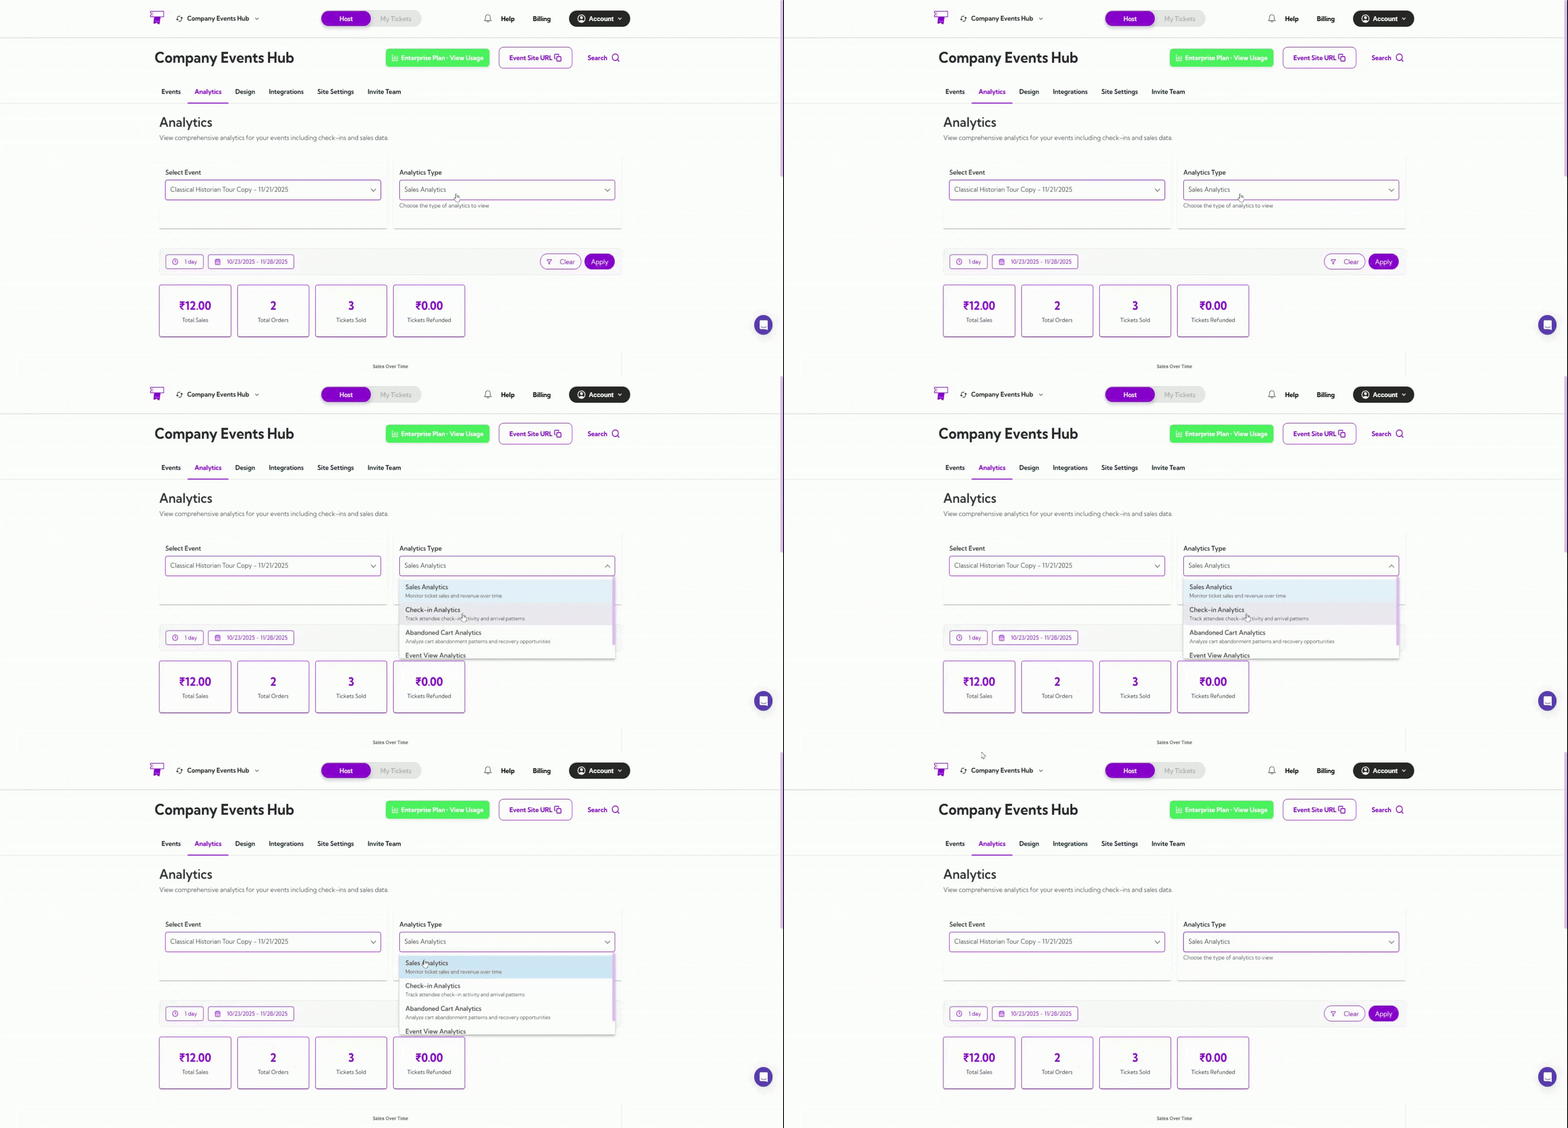
 ### Analytics Type
Switch between different analytics categories:
* **Sales Analytics**
* **Check-in Analytics**
* **Abandoned Cart Analytics**
* **Event View Analytics**
### Analytics Type
Switch between different analytics categories:
* **Sales Analytics**
* **Check-in Analytics**
* **Abandoned Cart Analytics**
* **Event View Analytics**
 ### Date Filters
You can filter analytics using preset ranges such as **1 day**, **7 days**, or **1 year** — or choose a **custom date range**.
### Date Filters
You can filter analytics using preset ranges such as **1 day**, **7 days**, or **1 year** — or choose a **custom date range**.
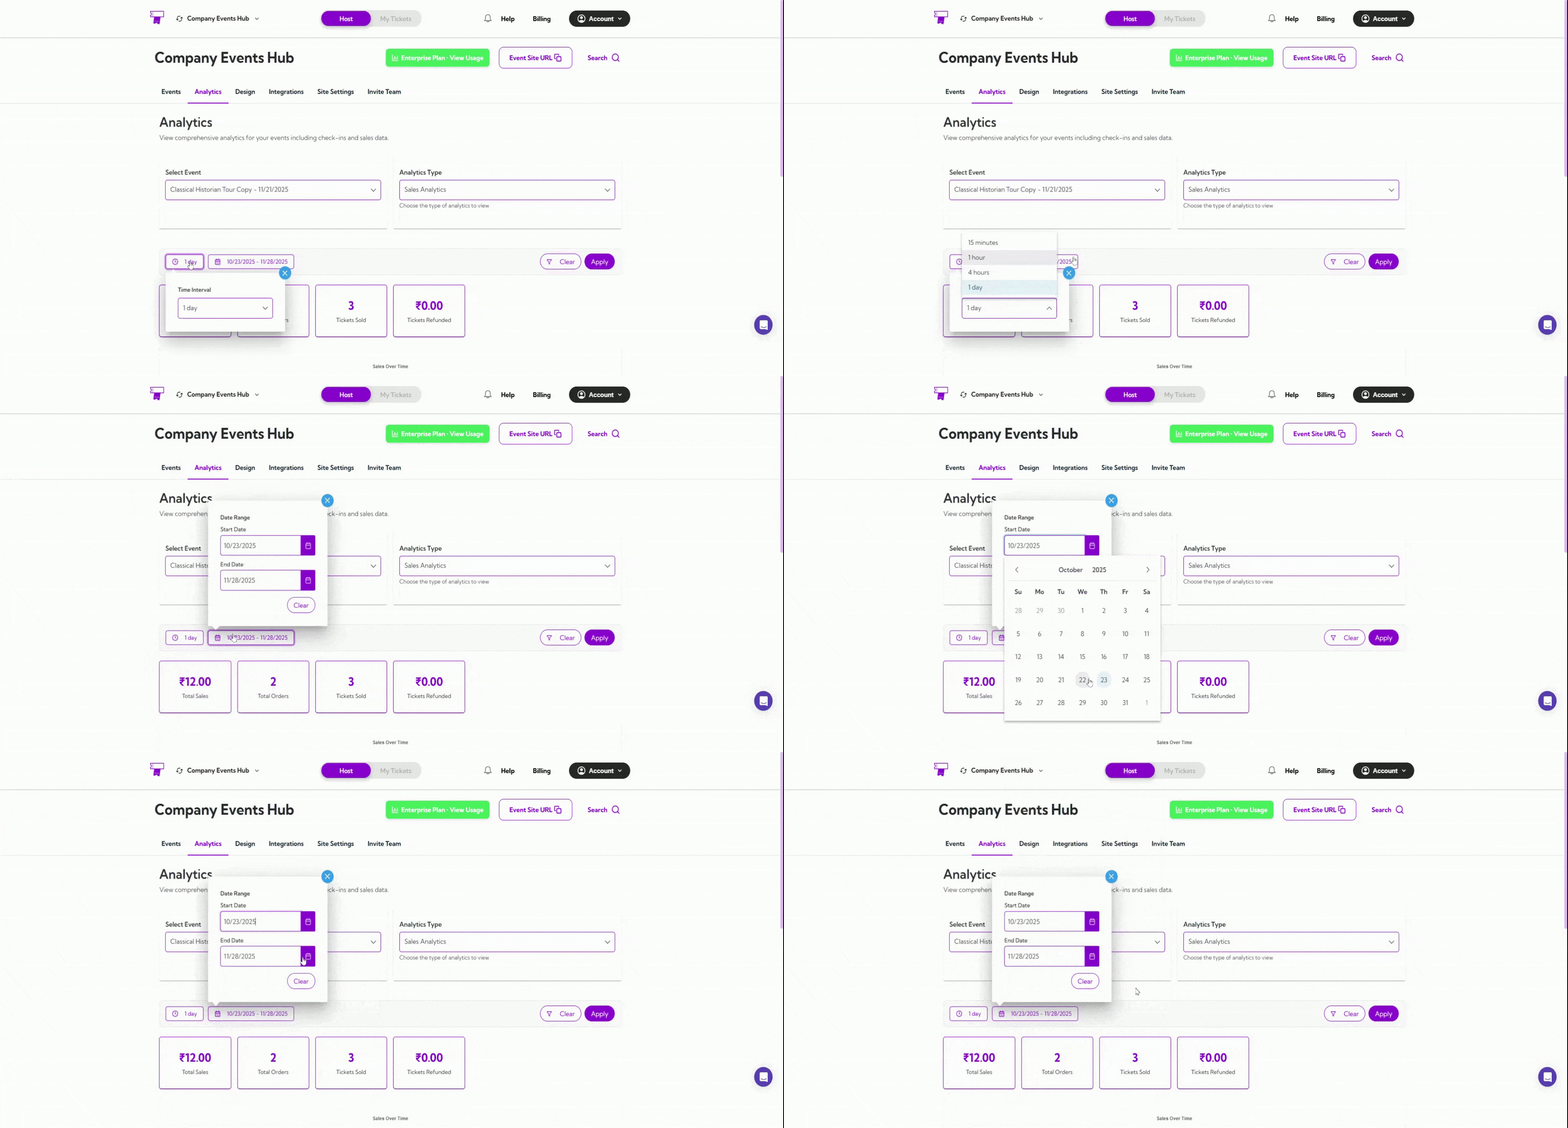 The dashboard updates instantly based on your selected timeframe.
## What You’ll See
Depending on the analytics type selected, the dashboard will display:
**Summary Metrics**\
Quick, high-level numbers like views, orders, tickets, conversions, or sales.
**Performance Graph**\
A visual chart showing activity trends across your chosen date range.
**Activity Table**\
A detailed table showing dates, IDs, counts, and other event-related insights.
The dashboard updates instantly based on your selected timeframe.
## What You’ll See
Depending on the analytics type selected, the dashboard will display:
**Summary Metrics**\
Quick, high-level numbers like views, orders, tickets, conversions, or sales.
**Performance Graph**\
A visual chart showing activity trends across your chosen date range.
**Activity Table**\
A detailed table showing dates, IDs, counts, and other event-related insights.