> ## Documentation Index
> Fetch the complete documentation index at: https://docs.ticketspotapp.com/llms.txt
> Use this file to discover all available pages before exploring further.
# Check-in Analytics
The **Check-in Analytics** dashboard gives you a clear, real-time view of how attendees are checking into your event. You can track total check-ins, unique attendees, and quickly understand check-in activity trends over time.
Let’s get started 🚀
## Navigation
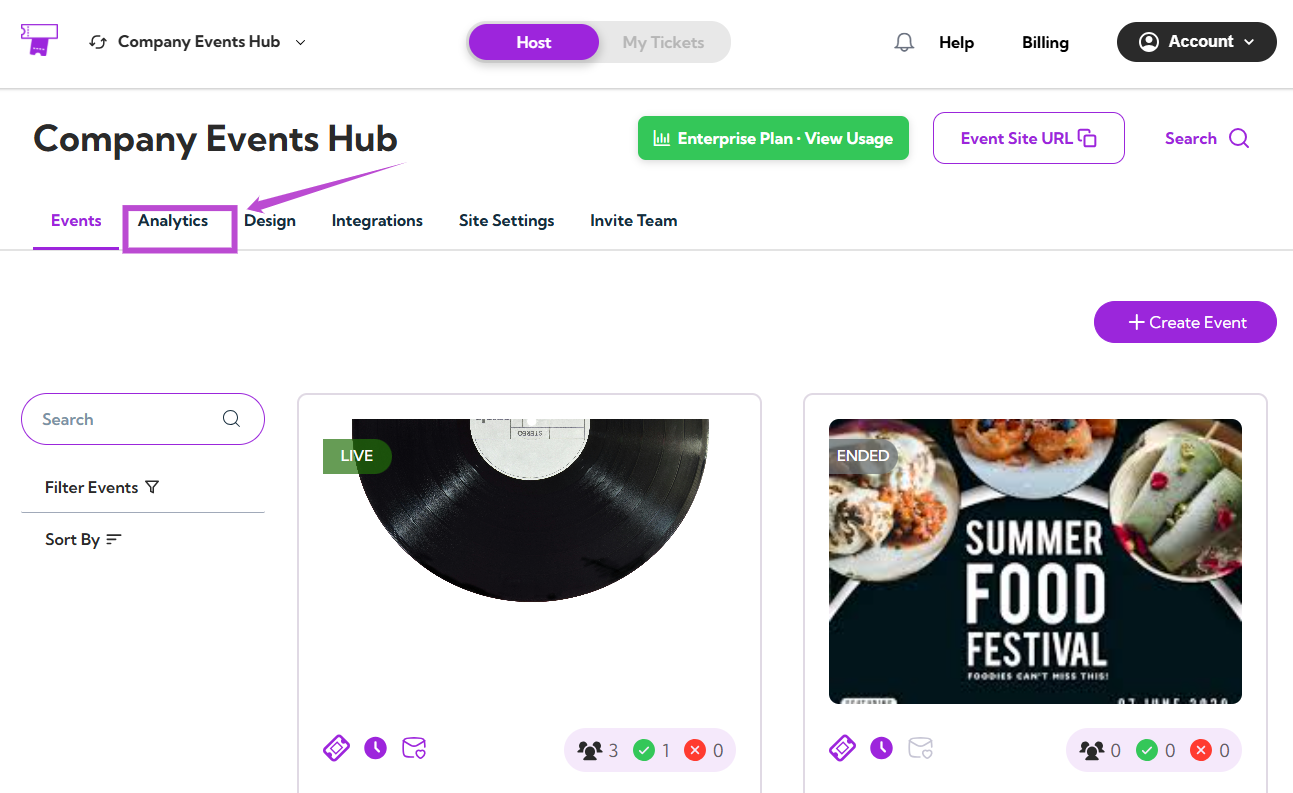
**Step 1:** Log in to your **TicketSpot** account and click the **Analytics** tab from the top navigation bar.
 **Step 2:** Click on the **Analytics Type drop-down** menu and select the **Check-in Analytics** type.
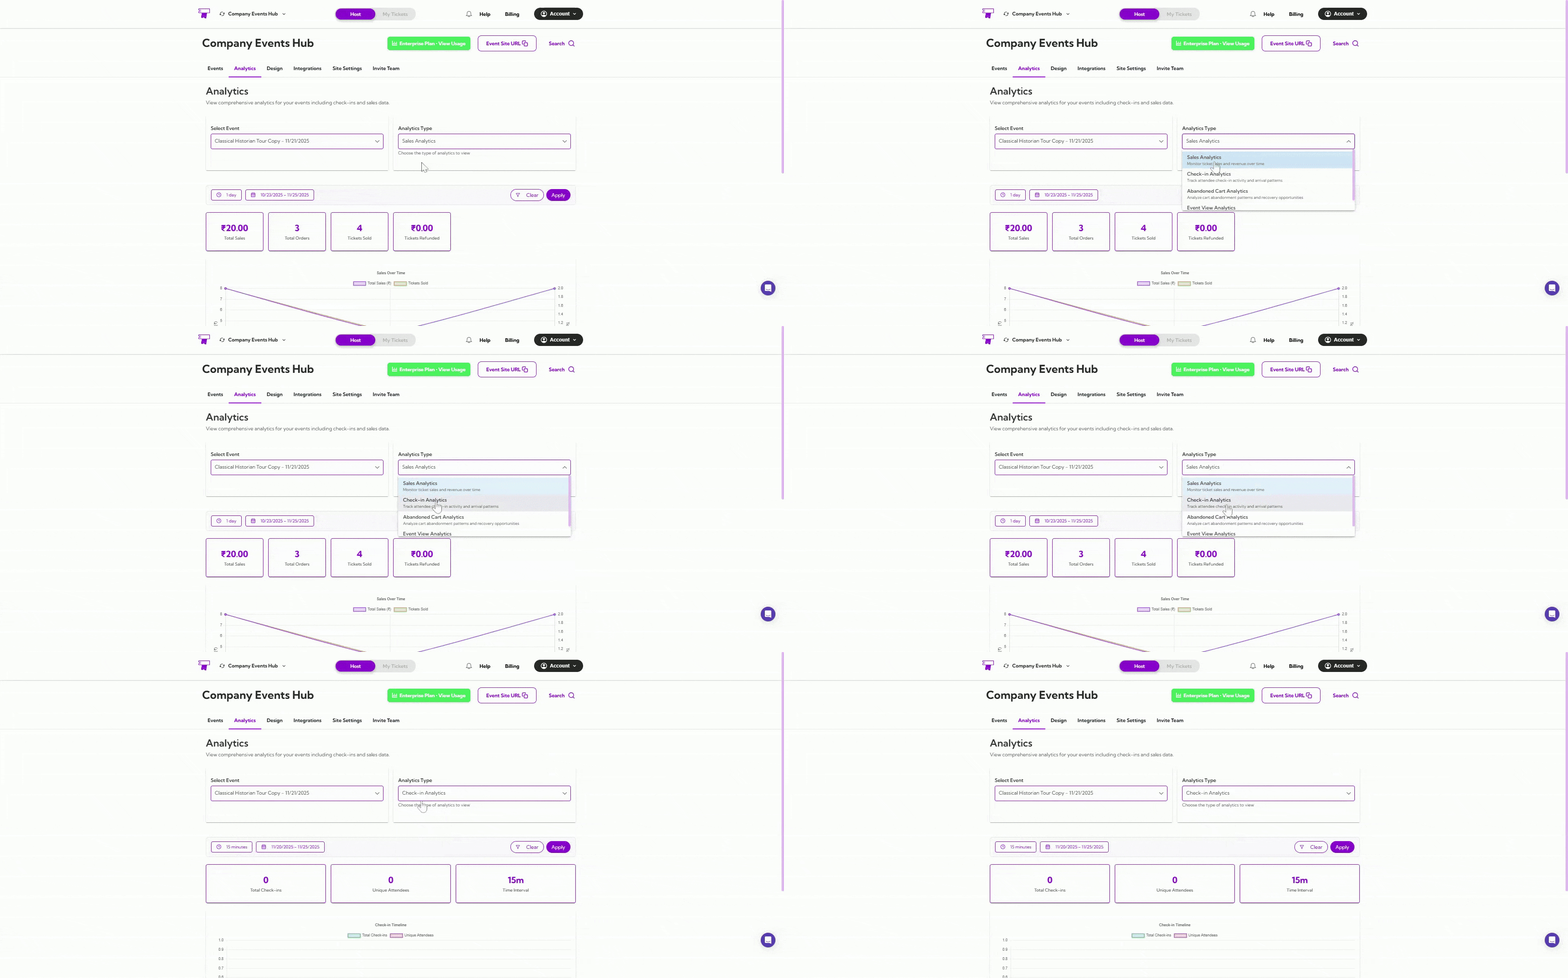 Your dashboard instantly updates to show all check-in-related insights.
## Select Event
Use the **Select Event** dropdown to choose the event you want to analyze.
Your dashboard instantly updates to show all check-in-related insights.
## Select Event
Use the **Select Event** dropdown to choose the event you want to analyze.
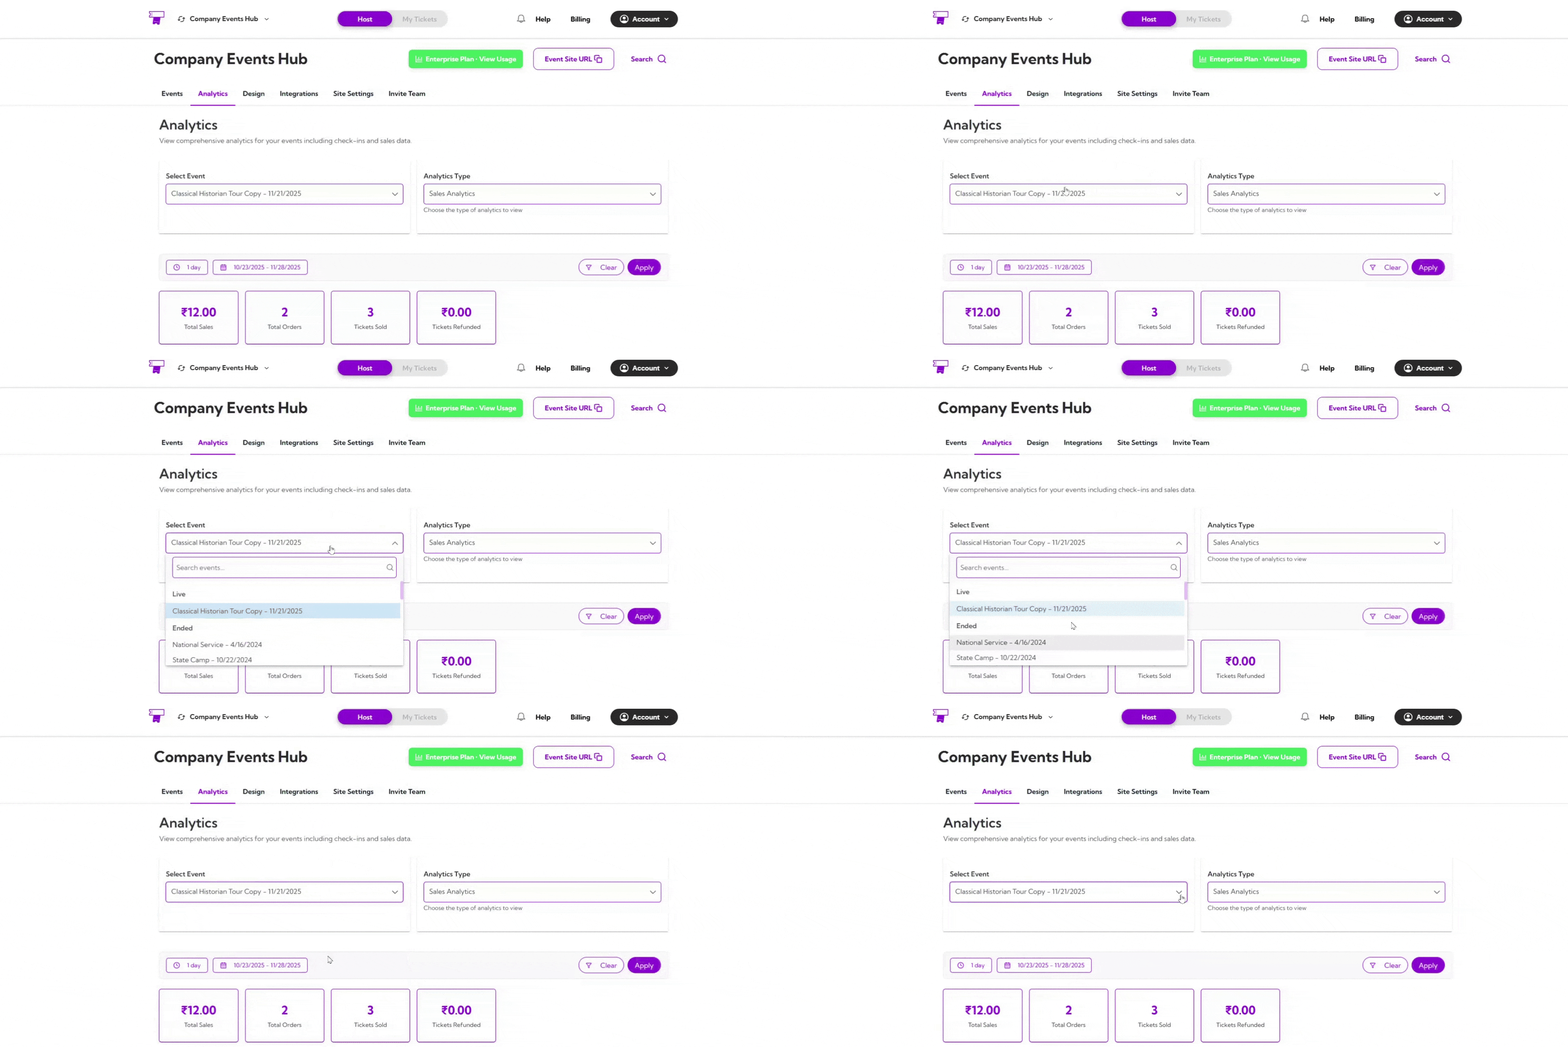 Once selected, all charts and metrics on the page will update to reflect that specific event’s check-ins.
## Date Filters
You can filter analytics by preset date ranges like **1 day**, **7 days**, or **1 year**, or choose a **custom date** range.
Once selected, all charts and metrics on the page will update to reflect that specific event’s check-ins.
## Date Filters
You can filter analytics by preset date ranges like **1 day**, **7 days**, or **1 year**, or choose a **custom date** range.
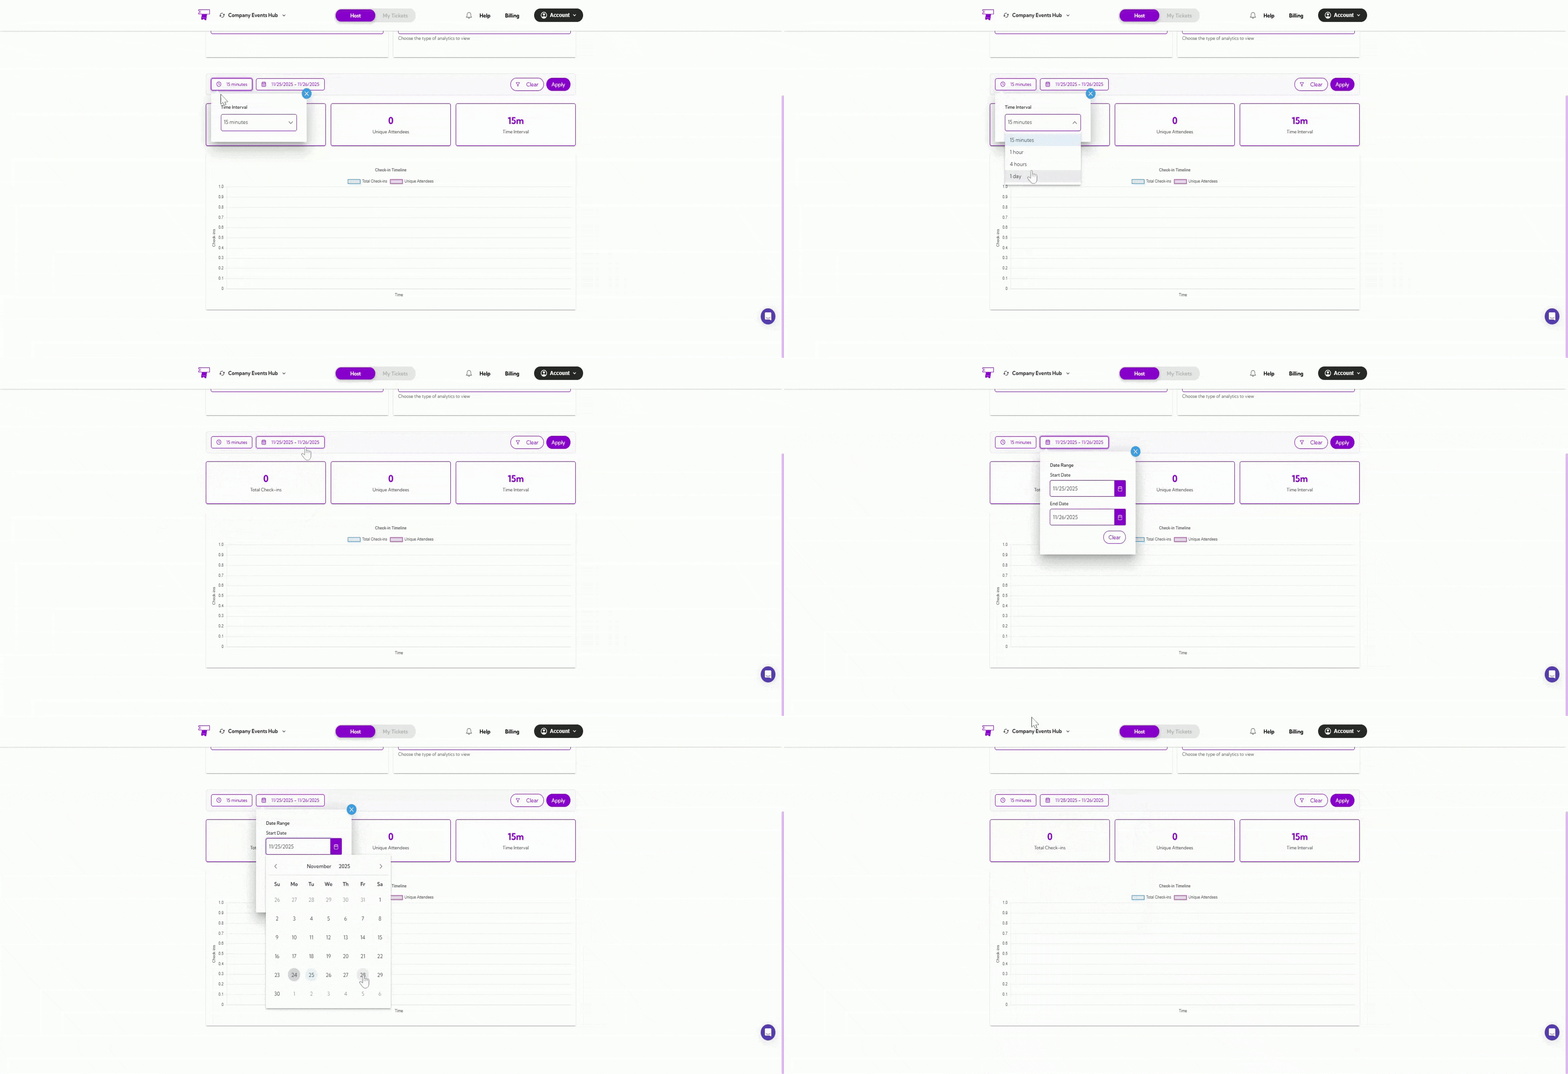 After applying the filters, the dashboard updates automatically based on the selected time window.
## Summary Metrics
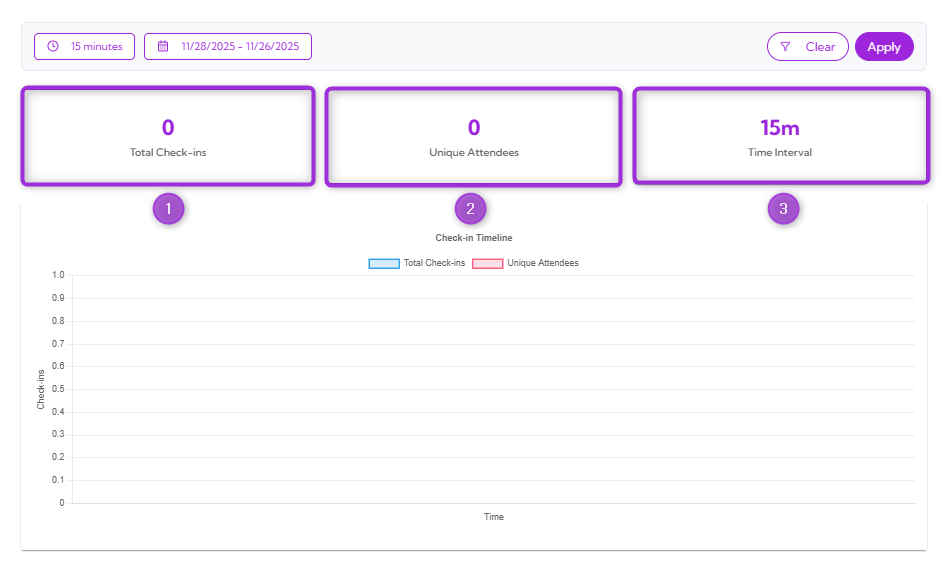
These metrics give you an instant snapshot of your event’s check-in activity, offering a quick overview of overall attendance.
| Ref No. | Metric Name | Description |
| ------- | -------------------- | ---------------------------------------------------- |
| 1. | **Total Check-ins** | Shows the total number of check-ins recorded. |
| 2. | **Unique Attendees** | Indicates how many individual attendees checked in. |
| 3. | **Time Interval** | Displays the selected check-in interval (e.g., 15m). |
After applying the filters, the dashboard updates automatically based on the selected time window.
## Summary Metrics
These metrics give you an instant snapshot of your event’s check-in activity, offering a quick overview of overall attendance.
| Ref No. | Metric Name | Description |
| ------- | -------------------- | ---------------------------------------------------- |
| 1. | **Total Check-ins** | Shows the total number of check-ins recorded. |
| 2. | **Unique Attendees** | Indicates how many individual attendees checked in. |
| 3. | **Time Interval** | Displays the selected check-in interval (e.g., 15m). |
 ## Check-in Timeline Graph
The **Check-in Timeline** graph displays how check-ins occurred over time within your selected date and interval.
The graph includes:
* A line for **Total Check-ins**
* A line for **Unique Attendees**
## Check-in Timeline Graph
The **Check-in Timeline** graph displays how check-ins occurred over time within your selected date and interval.
The graph includes:
* A line for **Total Check-ins**
* A line for **Unique Attendees**
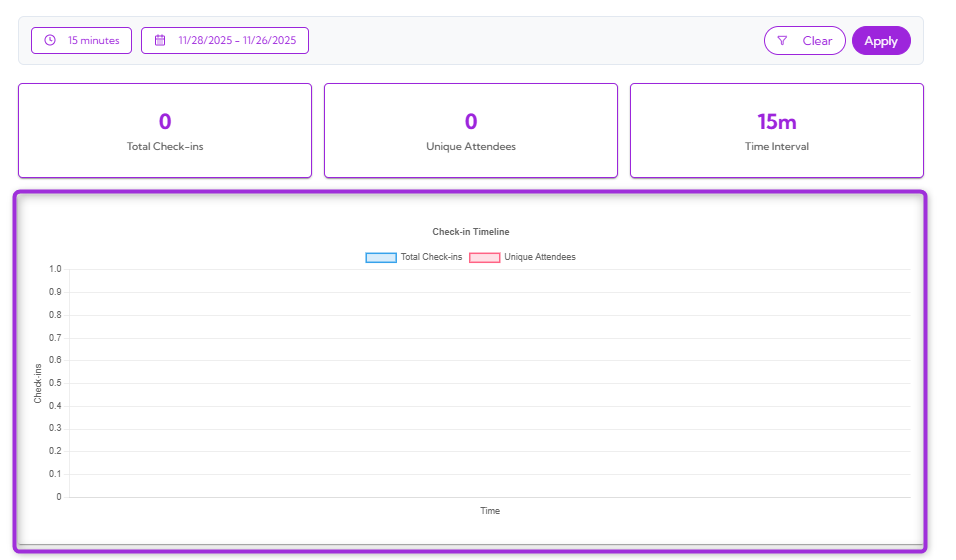 This graph helps you see when most people checked in, when it was slow, and whether check-ins were steady or suddenly increased.