Navigation
Step 1: Log in to your Ticket Spot account and click the Analytics tab from the top navigation bar.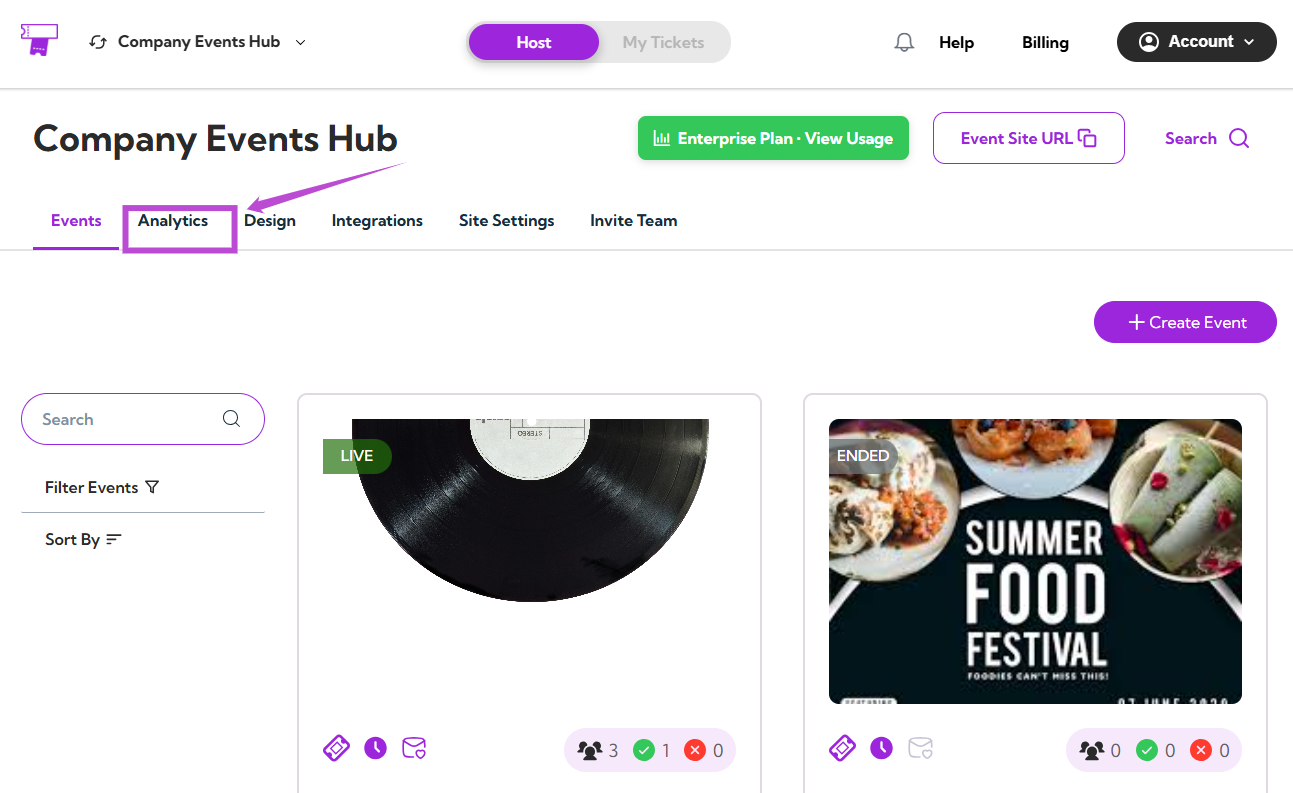
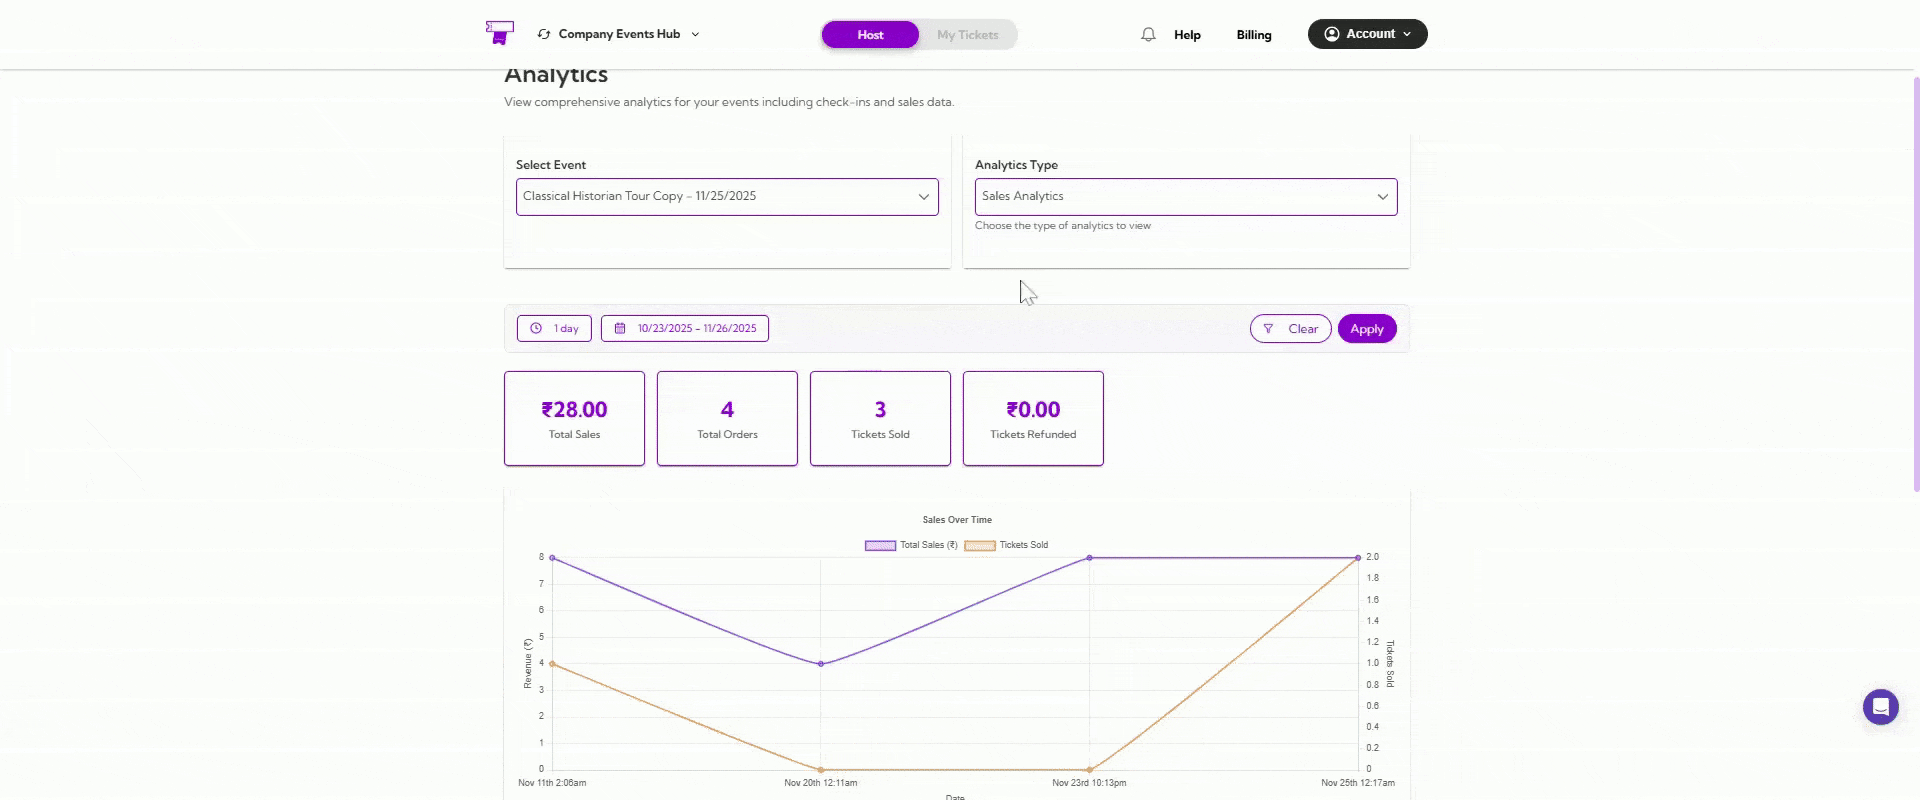
Select Event
Use the Select Event dropdown to choose the event you want to analyze.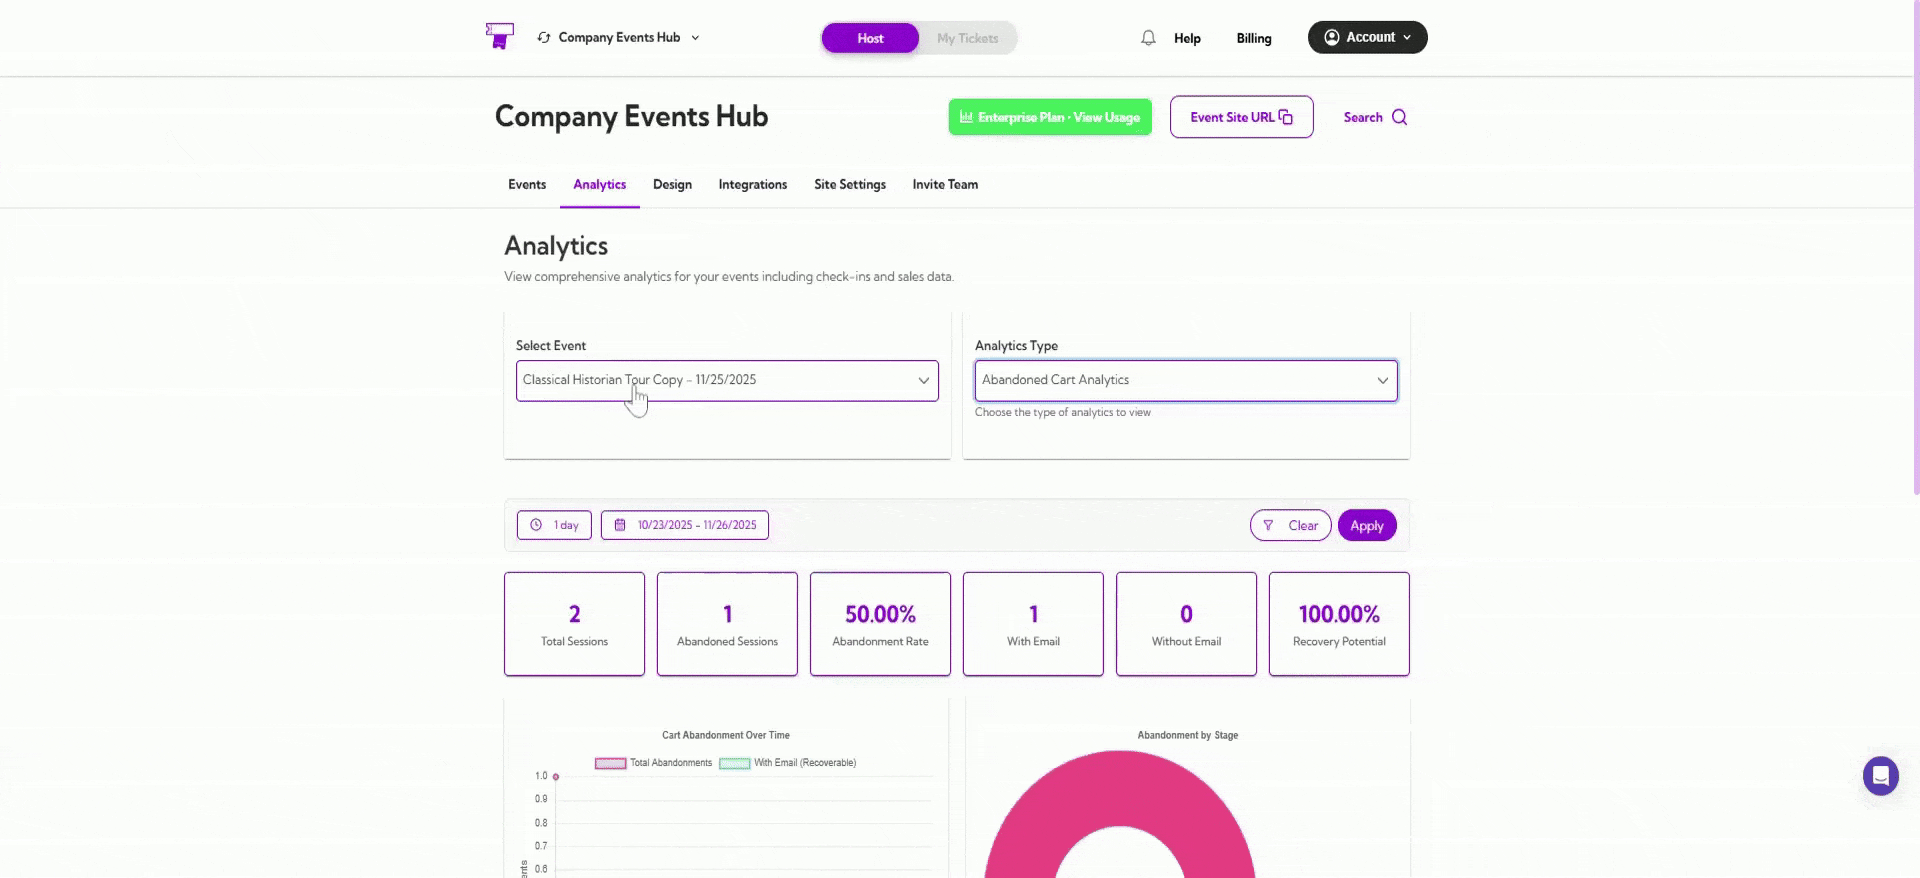
Date Filters
You can filter analytics by preset ranges like 1 day, 7 days, or 1 year, or choose a custom date range using the calendar.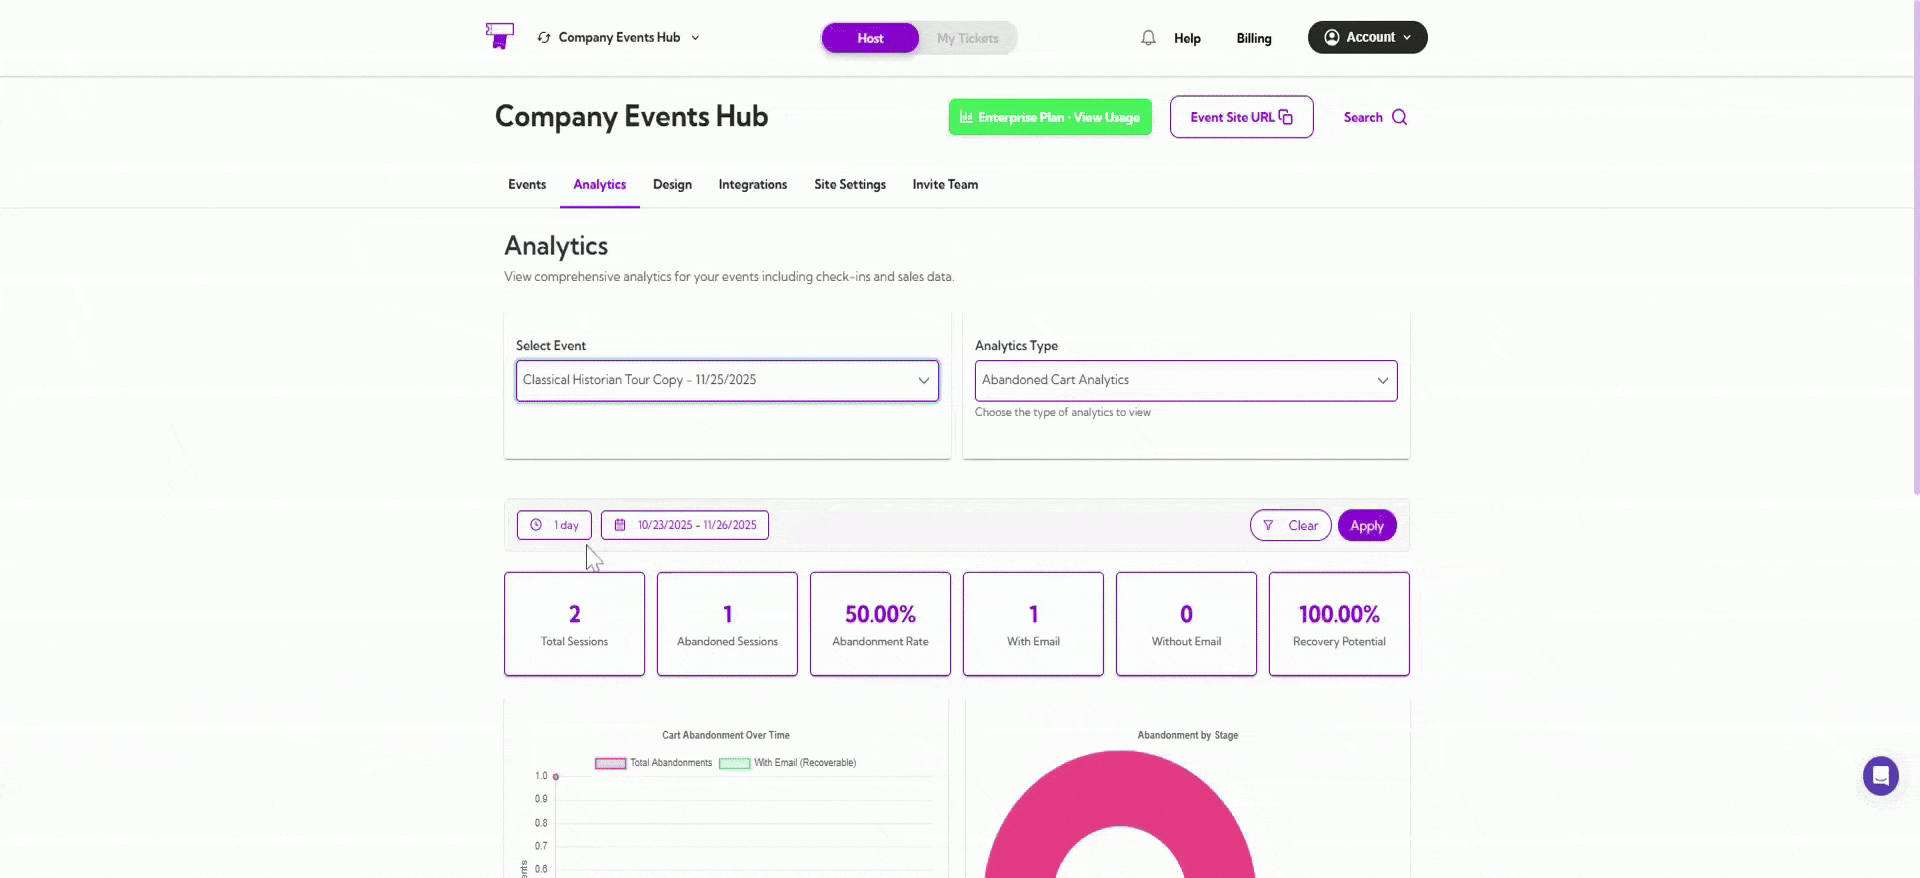
Summary Metrics
These metrics give you a quick snapshot of your event’s cart abandonment activity.| Ref No. | Metric Name | Description |
|---|---|---|
| 1. | Total Sessions | Total checkout sessions started. |
| 2. | Abandoned Sessions | Number of sessions where checkout was not completed. |
| 3. | Abandonment Rate (%) | Percentage of sessions that ended without a purchase. |
| 4. | With Email | Abandoned sessions where the user provided an email (recoverable). |
| 5. | Without Email | Sessions abandoned before email was entered (non-recoverable). |
| 6. | Recovery Potential (%) | Percentage of abandoned sessions that can be recovered via email. |
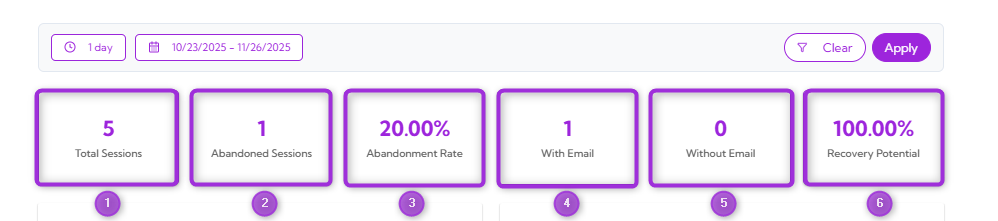
Cart Abandonment Over Time
This graph shows when cart abandonments happened during your selected date range.- The pink line shows the total number of abandonment events.
- The blue line shows recoverable abandonments where the customer entered an email.
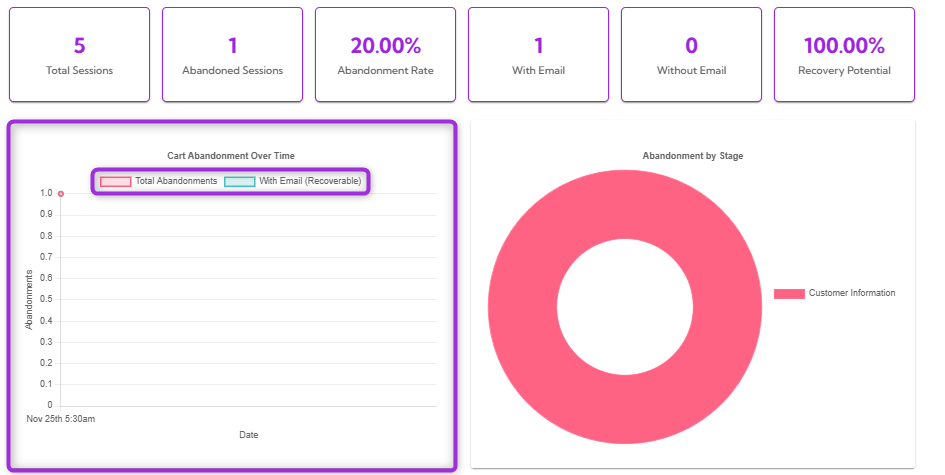
Abandonment by Stage
This donut chart shows which step of the checkout process customers abandoned. For example, all abandonments happened at the Customer Information stage. This helps you quickly identify where users drop off so you can improve that part of the checkout flow.
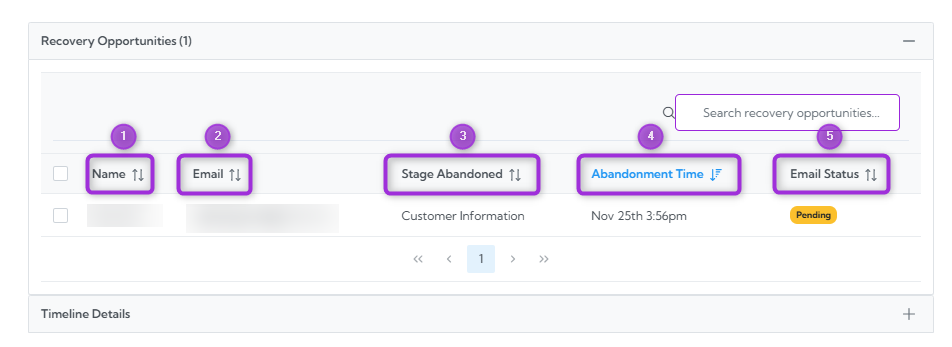
Recovery Opportunities
The Recovery Opportunities section lists all abandoned checkout sessions where customers entered an email address. These sessions are recoverable, meaning you can contact the customer to complete their purchase. This table helps you see who abandoned their cart, when they left, and whether follow-up emails have been sent.| Ref No. | Fields | Description |
|---|---|---|
| 1. | Name | The customer’s name was captured during checkout. |
| 2. | The email address entered by the customer. | |
| 3. | Stage Abandoned | The step at which the customer dropped off. |
| 4. | Abandonment Time | The exact time the abandonment occurred. |
| 5. | Email Status | Shows whether the recovery email is Pending, Sent, or Failed. |
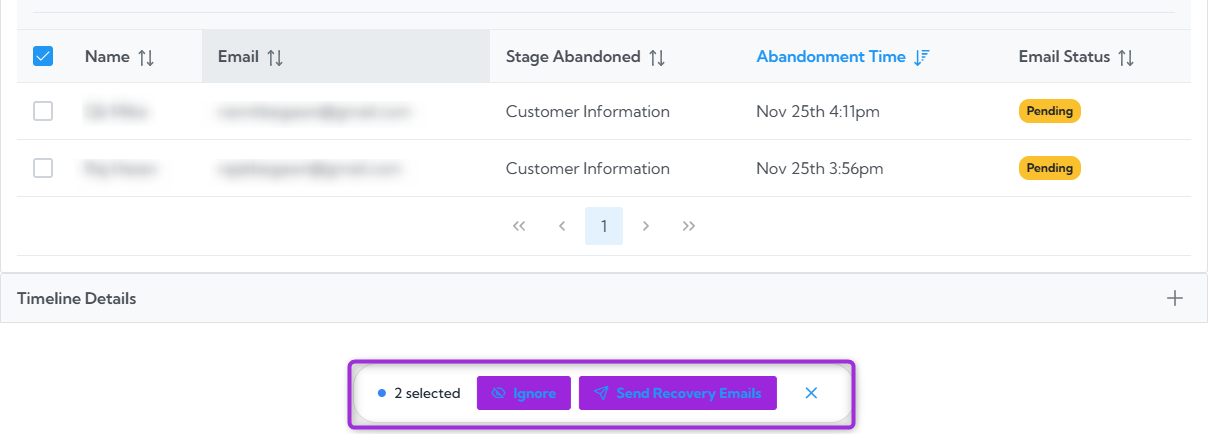
Ignore
Use Ignore when you do not want to send a recovery email to the selected customer. This simply marks the entry so you can skip it.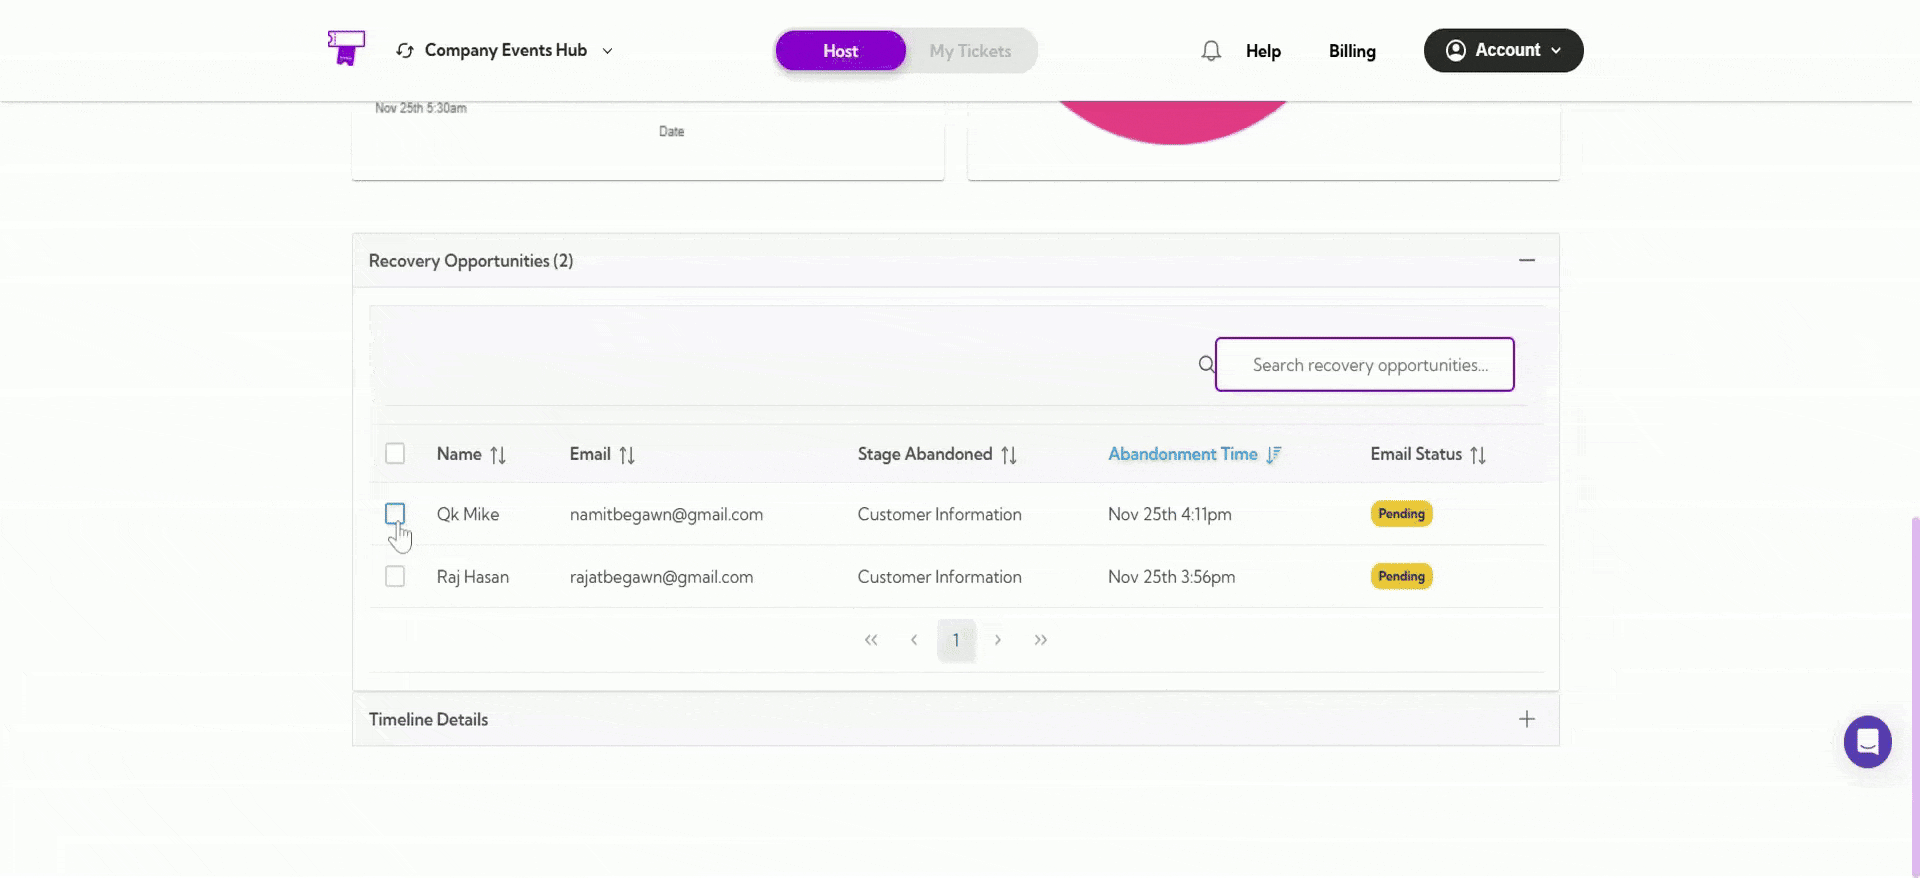
Send Recovery Emails
Use Send Recovery Emails to contact the customer and remind them to complete their purchase. This helps recover abandoned carts and increase your event revenue.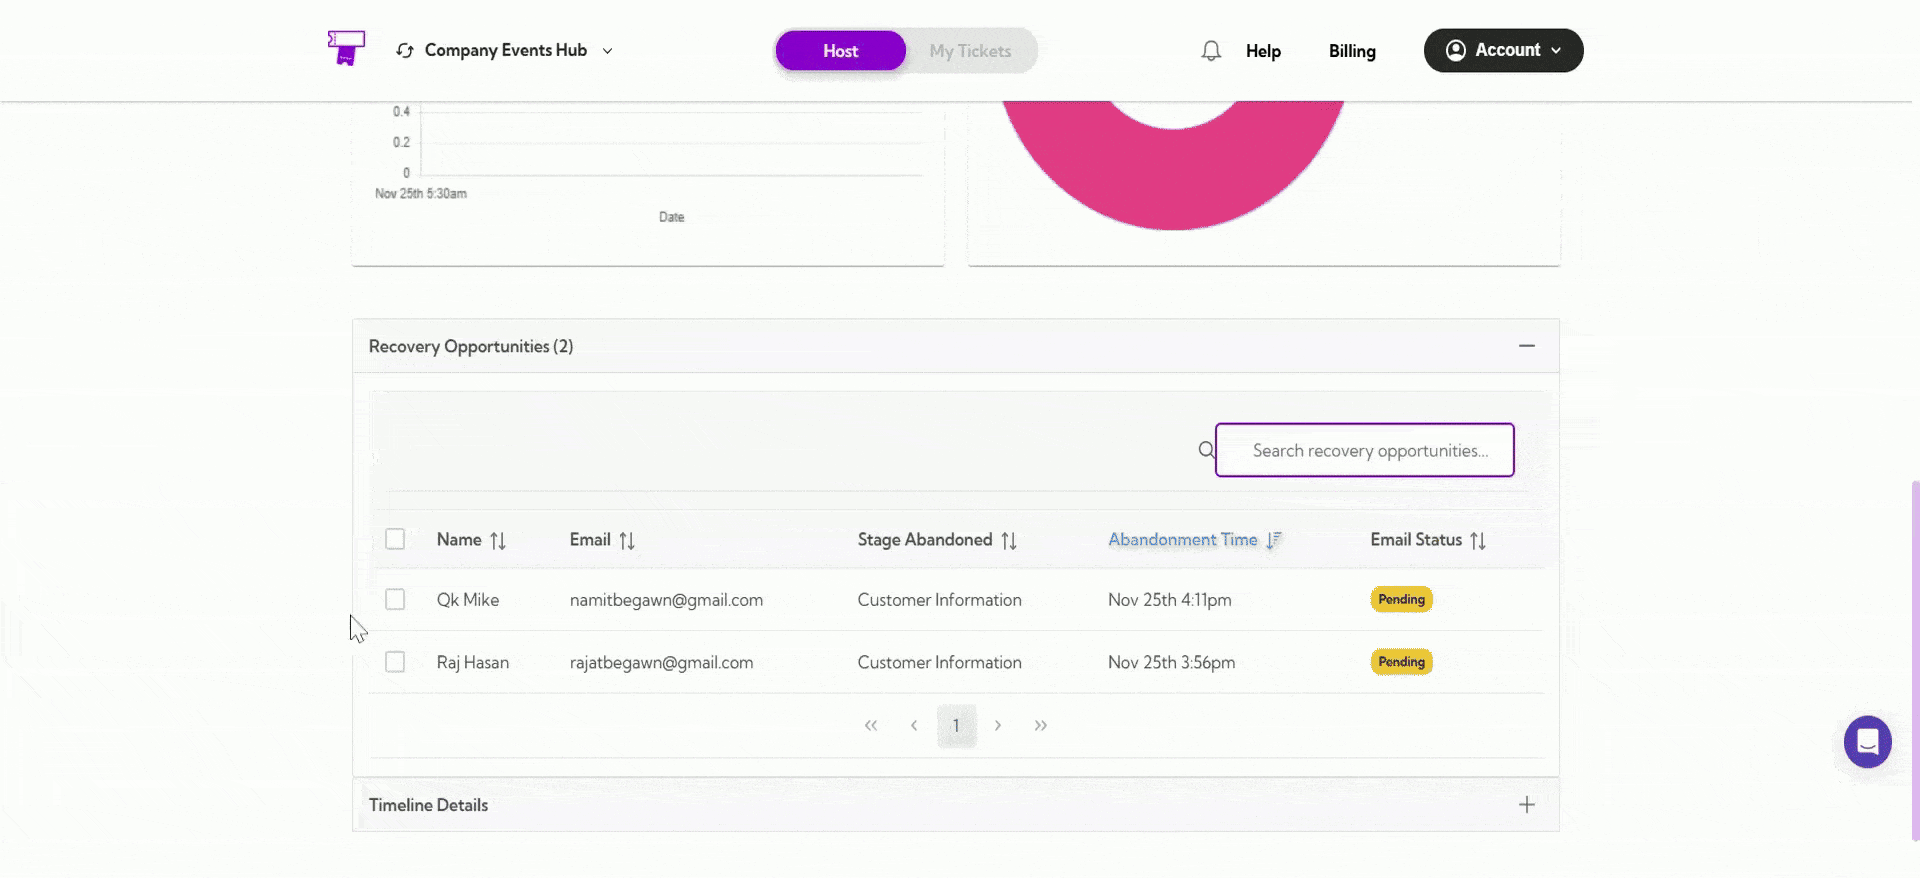
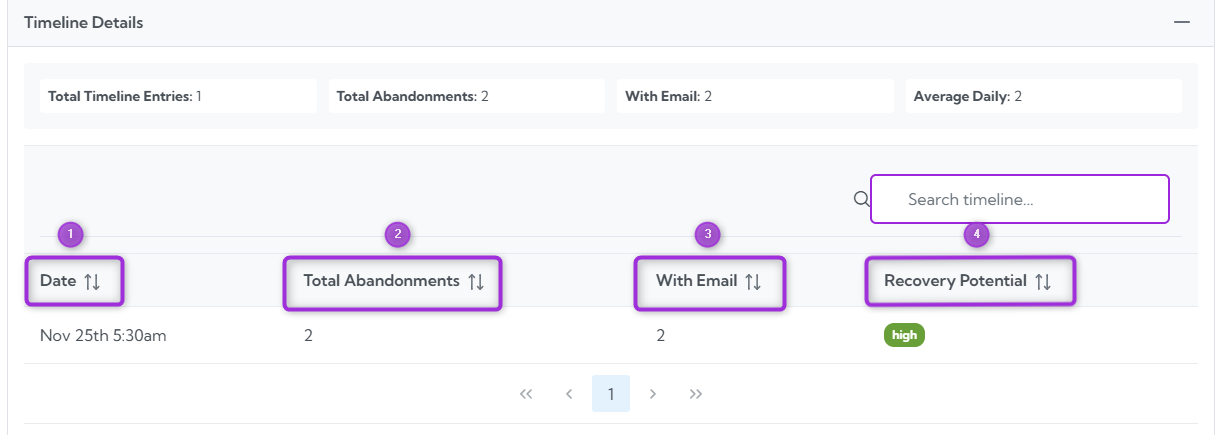
Timeline Details
The Timeline Details section provides a breakdown of all abandonment events by date. This helps you understand when users are leaving the checkout flow and how often abandonment occurs over time. At the top, you’ll see a quick summary showing:- Total Timeline Entries – number of unique dates with abandonment activity
- Total Abandonments – total number of abandoned sessions
- With Email – how many of those abandonments included an email (recoverable)
- Average Daily – the average number of abandonments per day

| Ref No. | Fields | Description |
|---|---|---|
| 1. | Date | The date on which the abandonment occurred. |
| 2. | Total Abandonments | The number of abandonments recorded on that day. |
| 3. | With Email | How many abandonments included an email address. |
| 4. | Recovery Potential | Shows the likelihood of recovering the abandoned cart (e.g., high). |