Navigation
Step 1: Log in to your TicketSpot account and click the Analytics tab from the top navigation bar.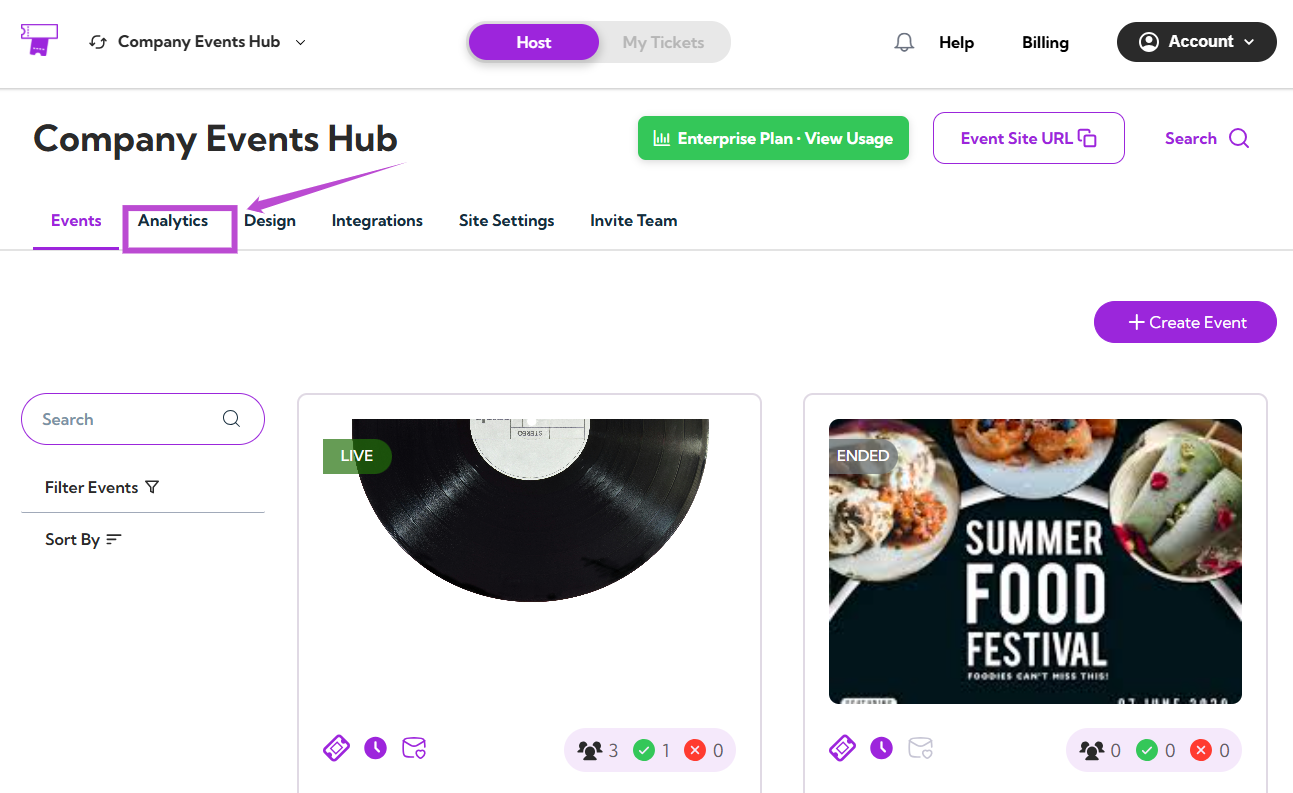
Select Event
Use the Select Event dropdown to choose the event you want to analyze.
Date Filters
You can filter analytics by preset date ranges like 1 day, 7 days, or 1 year, or choose a custom date range.
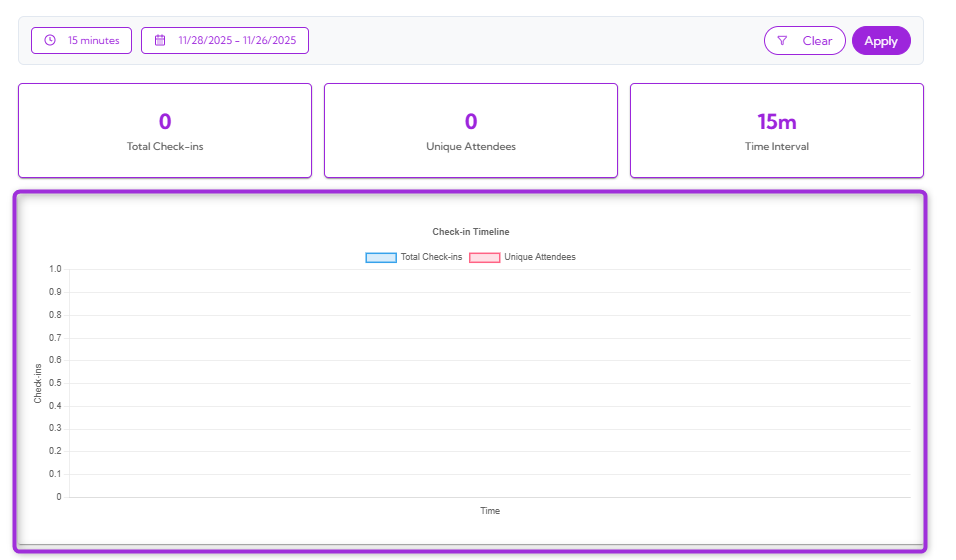
Summary Metrics
These metrics give you an instant snapshot of your event’s check-in activity, offering a quick overview of overall attendance.| Ref No. | Metric Name | Description |
|---|---|---|
| 1. | Total Check-ins | Shows the total number of check-ins recorded. |
| 2. | Unique Attendees | Indicates how many individual attendees checked in. |
| 3. | Time Interval | Displays the selected check-in interval (e.g., 15m). |
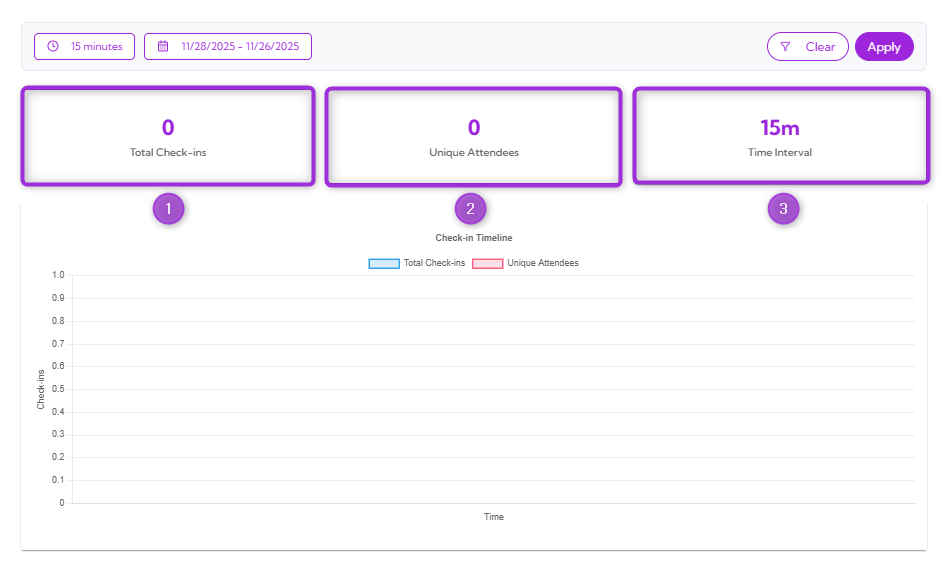
Check-in Timeline Graph
The Check-in Timeline graph displays how check-ins occurred over time within your selected date and interval. The graph includes:- A line for Total Check-ins
- A line for Unique Attendees